January CPI Inflation Report Coming Friday: What You Need to Know
The delayed January CPI report drops Friday with economists forecasting 2.5% annual inflation. Here's what it means for your money and the Fed's next move.
John Mitchell
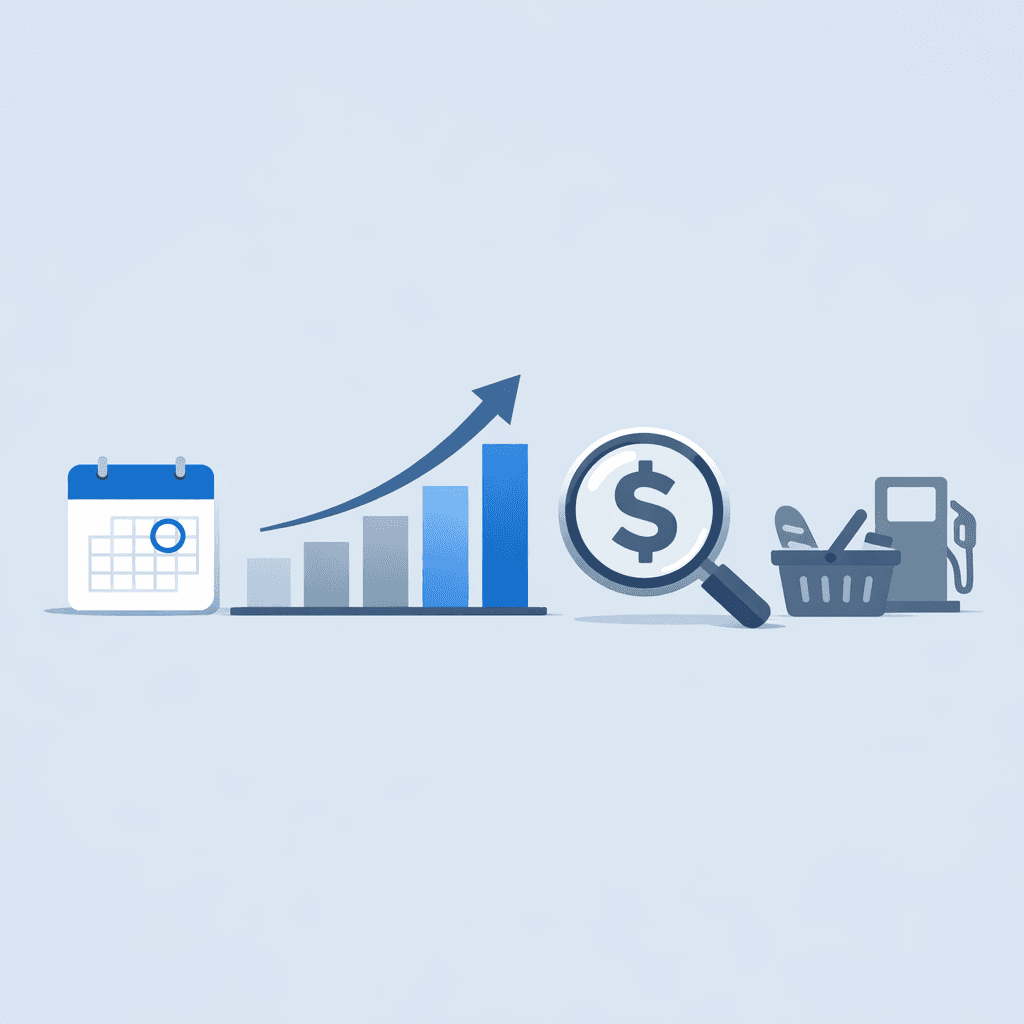
After a brief government shutdown scrambled the federal data calendar, the most anticipated inflation report of the year is finally arriving. The Bureau of Labor Statistics will release the January Consumer Price Index (CPI) this Friday, February 14th, and economists are forecasting a 2.5% year-over-year increase in headline inflation.
That number matters more than you might think. It could determine whether the Federal Reserve starts cutting rates this year—or keeps them elevated through summer.
Why This Report Got Delayed
The four-day government shutdown that hit at the end of January forced the BLS to suspend operations right as they were crunching January's price data. Originally scheduled for February 11th, the CPI release got pushed to Friday the 14th.
According to analysts at Goldman Sachs and RBC, the data integrity remains intact despite the delay. The bigger concern for markets isn't the postponement—it's what the numbers will actually show.
What Economists Are Expecting
The consensus forecast is landing around 2.5% annual inflation, which would represent a meaningful cooldown from late 2025. Here's the breakdown:
- Headline CPI: 2.5% year-over-year (expected)
- Monthly change: 0.3% (matching December's pace)
- Core CPI: 2.5% to 2.6% (excluding food and energy)
That 2.5% figure is crucial. It sits in what some analysts are calling the Fed's "comfort zone"—low enough to suggest inflation is under control, but still above the central bank's 2% target.
The Fed cut rates three times in 2025, but has held steady so far in 2026. Currently, the federal funds rate sits at 3.50%–3.75%, and officials have made it clear they want to see more progress on inflation before cutting again.
The "January Effect" Problem
Here's what could throw a wrench in the optimistic forecasts: the so-called "January effect."
Every January, businesses tend to reset pricing contracts and implement annual price increases. This seasonal pattern can make January inflation readings run hotter than the underlying trend would suggest.
Traders are particularly focused on "Core" CPI—the measure that strips out volatile food and energy prices. If that comes in elevated, it could signal that the "last mile" of the inflation fight remains the toughest stretch.
What This Means for Interest Rates
The CPI report will heavily influence what the Fed does at its March meeting. Here are the likely scenarios:
If CPI hits 2.5% or lower:
- Markets will likely price in one or two rate cuts for the second half of 2026
- The terminal rate could drop to 3.00%–3.25% by December
- Expect a broad market rally, especially in rate-sensitive sectors
If CPI surprises to the upside (above 2.5%):
- The Fed stays in "higher for longer" mode through summer
- Rate cuts get pushed to late 2026 or beyond
- High-growth tech stocks could take a hit
- Mortgage rates stay elevated
The 10-year Treasury yield has been hovering around 4.1%, reflecting a "wait and see" approach from institutional investors.
Winners and Losers
Different sectors have different stakes in this report:
-
Banks (JPMorgan, Bank of America): A steady inflation decline helps them price loans and maintain healthy margins without sudden policy swings.
-
Retailers (Walmart, Target, Amazon): Mixed outlook. Stable input costs help, but if service inflation stays sticky, they'll struggle to pass costs to already-stretched consumers.
-
Tech stocks (Nvidia, growth stocks): Most sensitive to Fed policy. If rates stay elevated, their high valuations face pressure. A cool CPI print is essentially a green light for the growth trade.
-
Homebuyers: Mortgage rates currently average around 6.8-7%. A favorable CPI could provide relief later this year.
The Powell-to-Warsh Transition
There's another layer to this story: leadership change at the Fed.
Jerome Powell's term as Chair expires May 15, 2026, and Kevin Warsh has been nominated as his successor. Warsh is historically perceived as more hawkish than Powell, meaning a CPI print even slightly above expectations could give the incoming leadership ammunition to keep rates higher for longer.
This transition adds uncertainty to an already complex picture. Markets are watching not just what the current Fed will do, but how the next Fed chair will interpret the data.
What to Watch Friday
When the report drops, focus on these numbers:
-
Headline CPI (year-over-year): The main event. 2.5% or below is bullish; above 2.6% is concerning.
-
Core CPI: Excludes food and energy. This is what the Fed really watches.
-
Supercore (services excluding housing): This is the stickiest component and will likely dictate the Fed's rate path more than anything else.
-
Month-over-month change: 0.3% is expected. Higher signals acceleration; lower signals faster cooldown.
The Bottom Line
Friday's CPI report is the biggest economic data point of the first quarter. The 2.5% forecast represents a delicate balance—low enough to suggest inflation is cooling, but high enough that the Fed can't declare victory.
If you're making major financial decisions—buying a home, refinancing, adjusting your portfolio—this report will influence the interest rate environment for the rest of the year. Mark your calendar for Friday morning.
My take: I'm cautiously optimistic we'll see something close to expectations. The trend has been our friend, and there's no major reason to expect a nasty surprise. But in this economy, I've learned to expect the unexpected.
Sources: Investopedia, Yahoo Finance, RBC Economics, FinancialContent Markets. Data as of February 9, 2026.
Continue Reading
More from Investing
 Investing
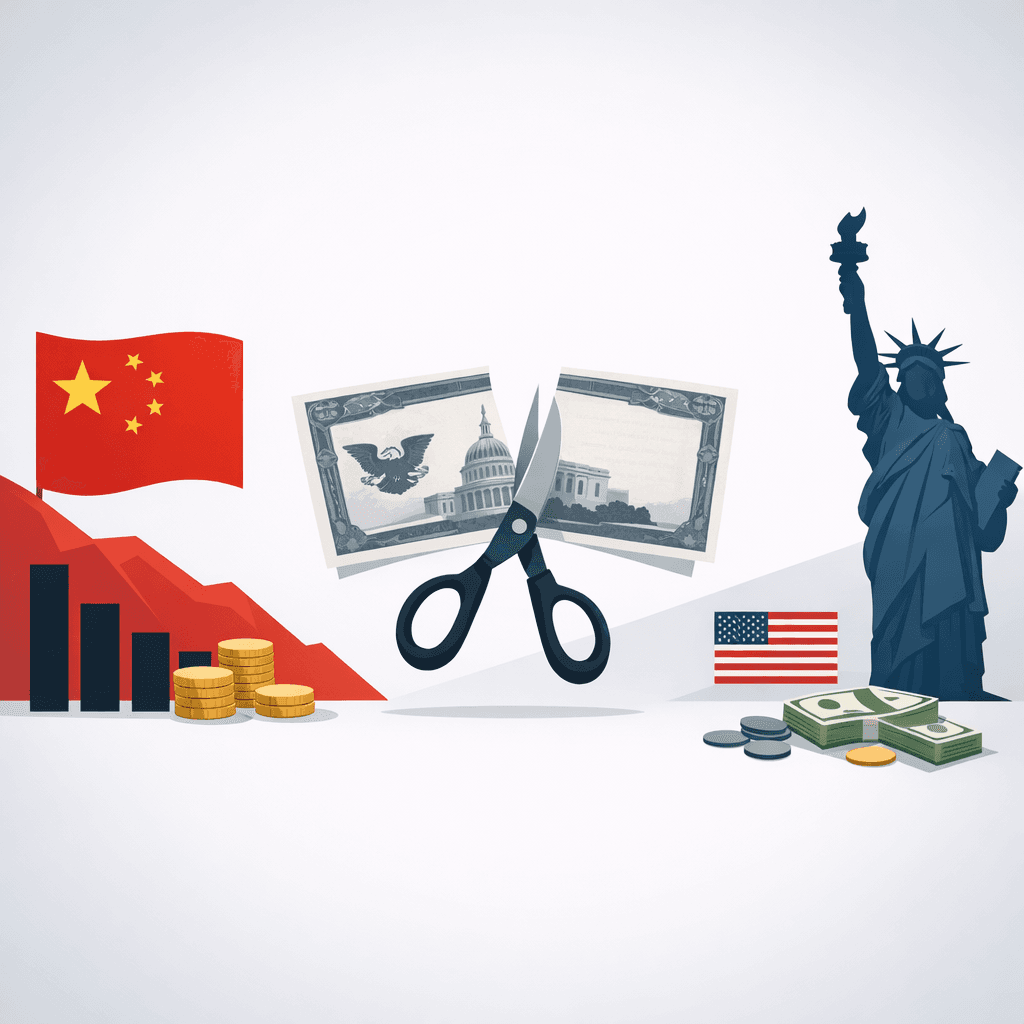
China Tells Banks to Cut US Treasury Holdings: What It Means for American Investors
Chinese regulators are urging banks to reduce their US Treasury exposure. Here's what this trend means for interest rates, the dollar, and your portfolio.
 Investing
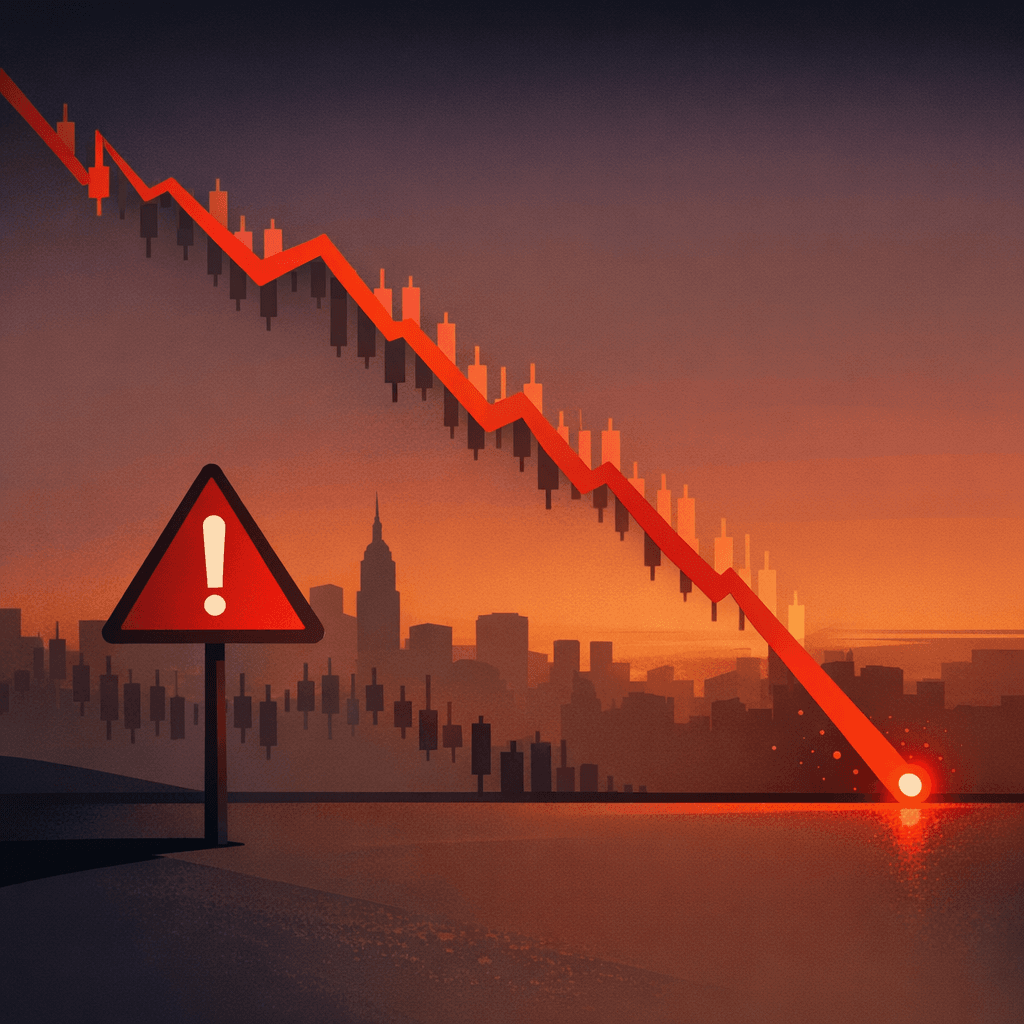
The Stock Market Is Flashing a Warning Sign Last Seen During the Dot-Com Crash
The S&P 500's CAPE ratio just hit levels last seen in October 2000 — right before the dot-com crash. Here's what this valuation metric means and whether you should be worried.
 Investing
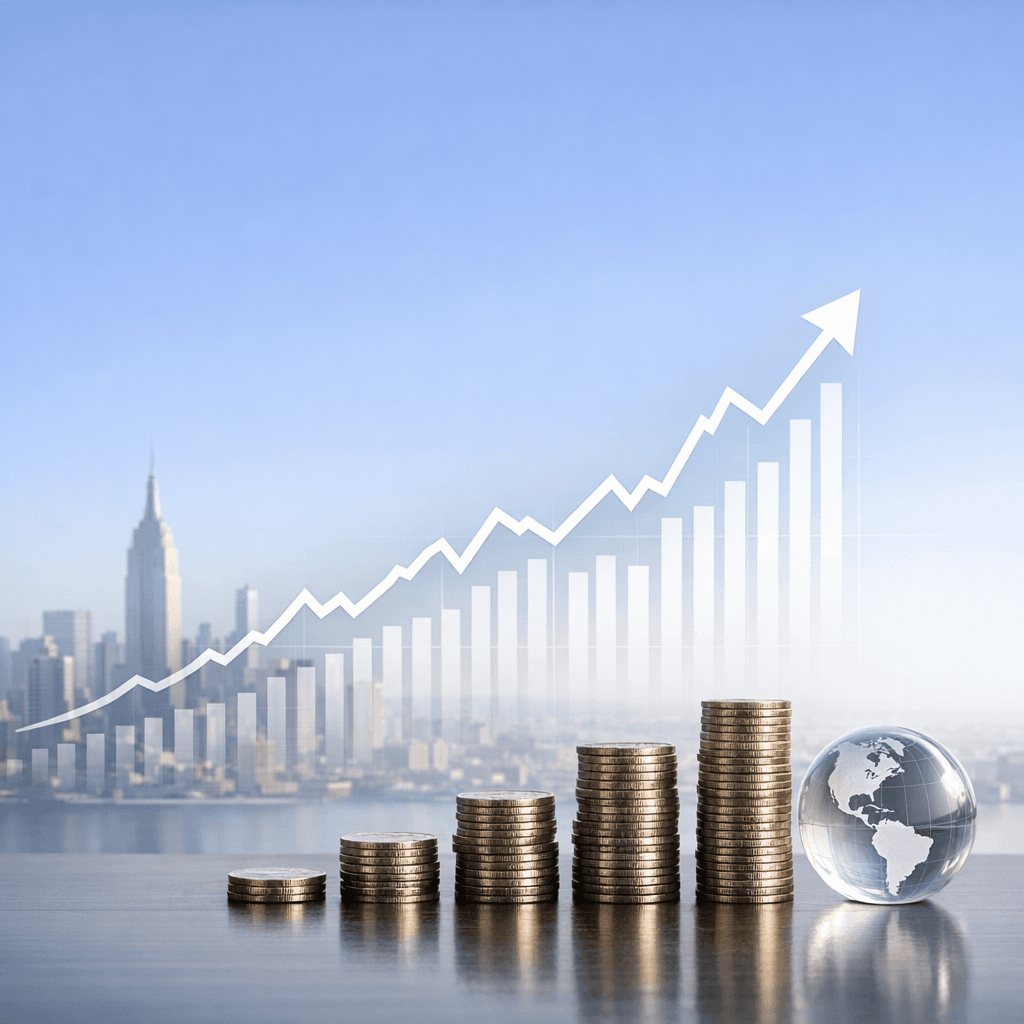
Dow Hits 50,000 for the First Time — What It Means for Your Portfolio
The Dow Jones Industrial Average closed above 50,000 for the first time in history on Friday. Here's what drove the rally and what this milestone actually means for everyday investors.
 Investing
Fed Holds Rates Steady, Trump Picks Kevin Warsh as Next Chair — What It Means for You
The Federal Reserve kept interest rates unchanged at 3.50%-3.75%, and Trump has nominated Kevin Warsh to replace Jerome Powell. Here's what this means for your mortgage, savings, and investments.
You May Also Find Interesting
 Retirement
401(k) Basics: Everything You Need to Know in 2026
Your employer offers a 401(k). Should you use it? How much should you contribute? What's a match? Here's the complete beginner's guide to the retirement account that could make you a millionaire.
 Crypto
Bitcoin for Beginners: What You Need to Know in 2026
Curious about Bitcoin but confused by the jargon? Here's a plain-English guide to what Bitcoin is, how it works, and whether it belongs in your portfolio.
 Credit
What's a Good Credit Score? The Numbers That Actually Matter in 2026
Your credit score affects everything from mortgage rates to job applications. But what's actually "good"? Here's what the numbers mean and what lenders really look for in 2026.
 Real Estate
Rent vs. Buy in 2026: The Math That Actually Matters
Should you rent or buy a home in 2026? Forget the emotional arguments. Here's the actual financial math to help you make the right decision for your situation.